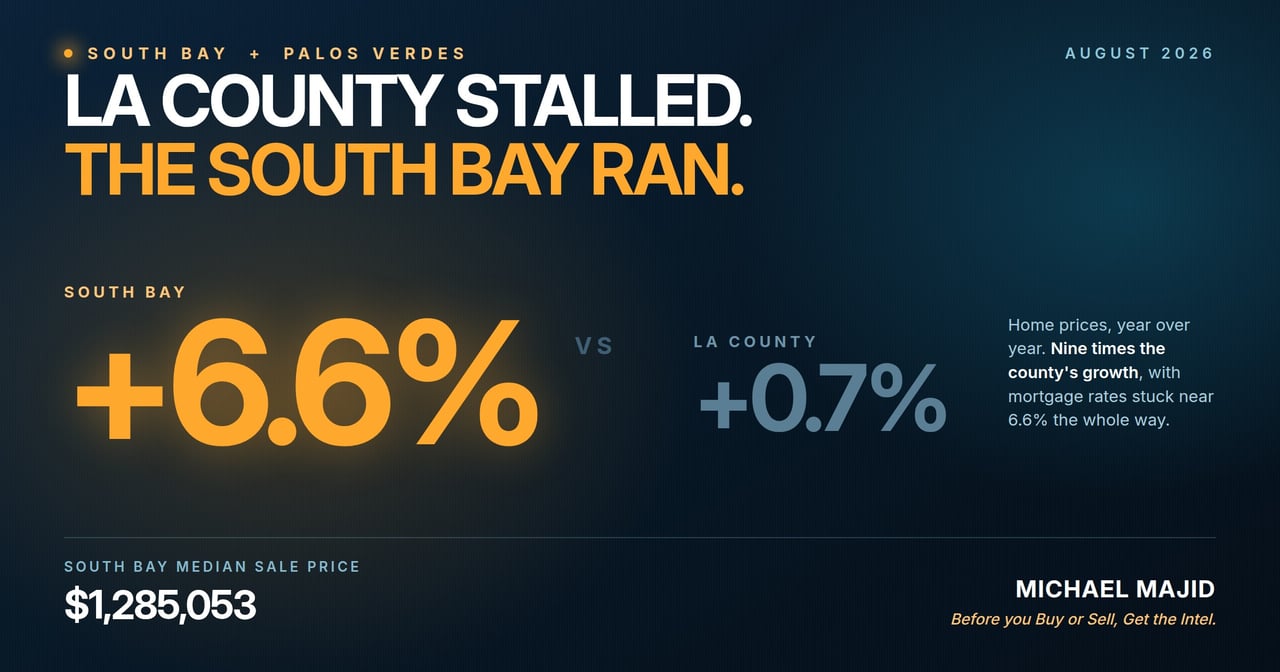
The Quick Intel: The South Bay real estate market softened in August 2026. Across nine cities, 280 homes closed at a median price of $1,460,000, down 7.4% from July's $1,577,000, and closed sales fell 11.1% month over month. Inventory sits at 616 active listings, roughly 2.2 months of supply at August's pace, and 39.4% of those active listings have already taken a price cut. Homes that did sell still moved fast, at a median of 16.5 days on market. This is a market rewarding accurate pricing and punishing everything else.
Two things can be true at once, and in August they were. Volume came down and the middle of the market gave back ground, while well-priced listings kept selling in under three weeks. If you are reading a headline that says the South Bay is either booming or collapsing, neither matches what the data actually shows.
A note on scope before the numbers. This report covers nine cities, and Torrance is new to it. Prior South Bay editions covered eight and left Torrance out, which meant the report skipped the single highest-volume city in the region. Torrance alone accounted for 83 of August's 280 closed sales. The city count changed because the coverage got better, not because a number moved.
What Did the South Bay Real Estate Market Do in August 2026?
All figures below cover closed sales with a close date between August 1 and August 31, 2026, with active inventory measured as of September 5, 2026.
Market Metric | August 2026 | vs. July 2026 | Market Trend |
|---|---|---|---|
Closed Sales | 280 | 315 | 🔴 Declining |
Median Sale Price | $1,460,000 | $1,577,000 | 🔴 Softening |
Average Sale Price | $2,124,546 | $2,025,632 | 🟢 Up on high-end mix |
Total Closed Volume | $594.9M | 🟡 Steady | |
Median Days on Market | 16.5 | 18 | 🟢 Faster |
Active Listings (9/5/26) | 616 | 🟡 Balanced | |
Months of Inventory | 2.2 | 🟡 Tight | |
Active Listings Reduced | 39.4% | 🔴 Elevated |
The average sale price rose while the median fell. That is not a contradiction, it is a mix shift: a handful of very large closings at the top pulled the average up while the broad middle of the market drifted down. The median is the more honest read of what a typical South Bay seller experienced in August.
The Pulse: How Did Mortgage Rates Affect South Bay Home Prices in August 2026?
Mortgage rates did not collapse and they did not spike. According to Freddie Mac's Primary Mortgage Market Survey released September 3, 2026, the 30-year fixed-rate mortgage averaged 6.71%, up from 6.66% the prior week and up from 6.50% a year earlier. The 15-year fixed averaged 6.04%. Rates in the high sixes have now been the operating environment for long enough that buyers have stopped waiting for a rescue, but every incremental tick still trims a little purchasing power at the margin, and August is where that showed up.
The South Bay was not alone. The California Association of REALTORS® July 2026 Home Sales and Price Report, released August 17, 2026, put the Los Angeles County median sales price at $888,120, down 2.4% from June and down 2.6% year over year, with county sales activity off 8.7% month over month. Our nine-city numbers cover a different and considerably more expensive footprint than the county as a whole, so the levels are not comparable, but the direction is the same. This was a regional cooling, not a South Bay-specific problem.
What makes August interesting is the split between the top and the middle. Palos Verdes Estates recorded 23 closed sales in August 2026 at a median price of $4,525,000, up sharply from July's $2,725,000. Read that carefully, because it is a mix story, not a 66% appreciation story. August in Palos Verdes Estates included several closings above $7 million and one above $24 million, and 23 sales is a small enough sample that two or three trophy transactions move the median dramatically. The underlying market did not reprice by two thirds in thirty days, and anyone telling you otherwise is misreading a small sample.
Meanwhile the volume cities went the other way. Redondo Beach recorded 66 closed sales at a median of $1,520,000, down 4.4% from July. Torrance recorded 83 closed sales at a median of $1,175,000, down 2.0%. San Pedro recorded 33 closed sales at a median of $750,000, down 7.2%. Those three cities are where most South Bay transactions actually happen, and all three drifted down.
The price-reduction data is the number I would pay the most attention to. Of 616 active listings across the nine cities on September 5, 2026, 243 of them, or 39.4%, show a price reduction as their most recent MLS status change. In San Pedro that figure is 48.1%. In Redondo Beach it is 46.9%. In Hermosa Beach it is 44.1%. When nearly half the standing inventory in a city has already cut, the market is telling sellers something about where the original asking prices were.
Is Now a Good Time to Sell in the South Bay?
Yes, if you price to the market as it is today rather than as it was in the spring. The evidence is in two numbers side by side. Median days on market across the nine cities was 16.5 days in August, actually faster than July's 18 days. At the same time, 39.4% of the listings currently sitting on the market have cut their price. Homes are not sitting because buyers disappeared. They are sitting because a meaningful share of them launched above what the market will pay, and the ones that launched correctly went into escrow in about two weeks.
At 2.2 months, inventory is still tight by any historical standard. A balanced market runs closer to five or six months. The leverage has shifted from where it was two years ago, but it has not flipped.
Which South Bay Cities Have the Most Inventory Right Now?
Rancho Palos Verdes has the most standing supply relative to its sales pace, at 117 active listings and 4.5 months of inventory. Rolling Hills Estates follows at 4.3 months, San Pedro at 3.3, and Rolling Hills at 3.0. At the tight end, Palos Verdes Estates has just 1.2 months of inventory, Torrance 1.4, and Redondo Beach 1.7. A buyer looking for negotiating room in the Peninsula has more of it in Rancho Palos Verdes right now than anywhere else on the hill.
How Did Each South Bay City Perform in August 2026?
Palos Verdes Estates (90274): What Sold in August 2026?
Palos Verdes Estates recorded 23 closed sales in August 2026 at a median price of $4,525,000 and an average of $5,417,739. There were 27 active listings as of September 5, 2026, about 1.2 months of inventory, with 22.2% showing a price reduction. Median days on market was 15.
This was the strongest month of the nine on paper, and the tightest inventory in the region. The caveat above matters: the median is inflated by an unusually top-heavy month, and 22.2% is the lowest price-reduction share of any city in this report, which is the more durable signal of health here.
Rancho Palos Verdes (90275): What Sold in August 2026?
Rancho Palos Verdes recorded 26 closed sales in August 2026 at a median price of $1,845,000 and an average of $2,005,923. There were 117 active listings as of September 5, 2026, about 4.5 months of inventory, with 40.2% showing a price reduction. Median days on market was 27.5.
The median rose 9.5% from July, but closed sales fell 35% and the city is carrying the heaviest inventory load in the report. RPV is the clearest buyer's opportunity on the Peninsula right now, particularly in the 90275 zip code where standing supply is deepest.
Rolling Hills (90274): What Sold in August 2026?
Rolling Hills recorded 4 closed sales in August 2026 at a median price of $4,637,500 and an average of $4,982,500. There were 12 active listings as of September 5, 2026, about 3.0 months of inventory, with 58.3% showing a price reduction. Median days on market was 50.
Four sales is too small a sample to call a trend, and I will not pretend otherwise. What is worth noting is that 7 of the 12 standing listings inside the gates have cut their price, the highest share in the report. In a market this thin, that is the number that tells you where expectations and offers are meeting.
Rolling Hills Estates (90274): What Sold in August 2026?
Rolling Hills Estates recorded 7 closed sales in August 2026 at a median price of $2,500,000 and an average of $2,592,571. There were 30 active listings as of September 5, 2026, about 4.3 months of inventory, with 23.3% showing a price reduction. Median days on market was 21.
The median rose 8.9% from July on a low sales count. Inventory is on the deeper side at 4.3 months, and the low reduction share says sellers here are pricing more realistically out of the gate than their neighbors.
Manhattan Beach (90266): What Sold in August 2026?
Manhattan Beach recorded 22 closed sales in August 2026 at a median price of $3,437,500 and an average of $4,317,364. There were 59 active listings as of September 5, 2026, about 2.7 months of inventory, with 30.5% showing a price reduction. Median days on market was 19.5.
The median held up, rising 4.2% from July, but closed sales nearly halved from 43 to 22. That is the sharpest volume drop of any city in this report. Prices are steady, activity is not, and August is historically a slower month here as the Sand and Tree sections empty out.
Hermosa Beach (90254): What Sold in August 2026?
Hermosa Beach recorded 16 closed sales in August 2026 at a median price of $2,572,500 and an average of $2,605,812. There were 34 active listings as of September 5, 2026, about 2.1 months of inventory, with 44.1% showing a price reduction. Median days on market was 12.5.
Hermosa had the fastest median days on market in the report at 12.5 days, and the median rose 5.3% from July. It also has 44.1% of its standing inventory carrying a price cut. Both things are true: the right listing here trades in under two weeks, and a lot of listings did not start at the right number.
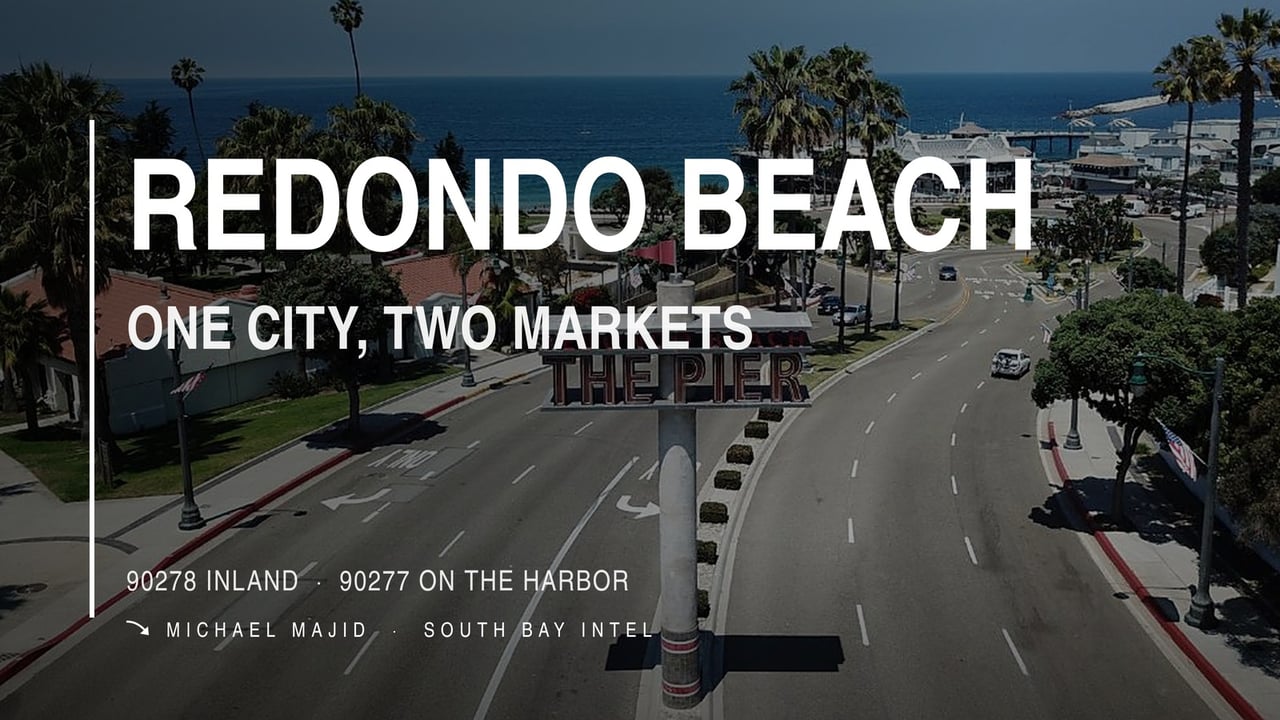
Redondo Beach (90277 and 90278): What Sold in August 2026?
Redondo Beach recorded 66 closed sales in August 2026 at a median price of $1,520,000 and an average of $1,798,652. There were 113 active listings as of September 5, 2026, about 1.7 months of inventory, with 46.9% showing a price reduction. Median days on market was 18.5.
Redondo was the second-busiest city in the report, and one of only three where closed sales rose from July, up 13.8%. The median slipped 4.4%. More homes trading at slightly lower prices, with only 1.7 months of supply, describes a market that is absorbing well but not stretching.
Torrance (90501 to 90505): What Sold in August 2026?
Torrance recorded 83 closed sales in August 2026 at a median price of $1,175,000 and an average of $1,192,795. There were 116 active listings as of September 5, 2026, about 1.4 months of inventory, with 32.8% showing a price reduction. Median days on market was 13.
Torrance is the volume engine of the South Bay and the most stable line in this report. The median moved 2.0%, which is noise, and homes sold at a median of 13 days with only 1.4 months of standing supply. Across West Torrance, Southwood, Hollywood Riviera and Old Torrance, this is the closest thing the region has to a steady-state market.
San Pedro (90731 and 90732): What Sold in August 2026?
San Pedro recorded 33 closed sales in August 2026 at a median price of $750,000 and an average of $777,121. There were 108 active listings as of September 5, 2026, about 3.3 months of inventory, with 48.1% showing a price reduction. Median days on market was 22.
San Pedro is the most affordable entry point in this report and it is also under the most visible pricing pressure. The median fell 7.2% from July and 48.1% of standing listings have cut, the highest share of any city here. For a buyer with a budget under $900,000 who wants coastal Los Angeles, this is where the negotiating leverage is.
What Were the Highest-Priced South Bay Home Sales in August 2026?
August's top closings were concentrated on the Peninsula and in Manhattan Beach. The single largest transaction of the month closed in Palos Verdes Estates at $24,258,000. A second Palos Verdes Estates property closed at $15,795,000, and Manhattan Beach recorded a $12,500,000 closing and a $10,395,000 closing. Rolling Hills produced an $8,305,000 sale and Rancho Palos Verdes an $8,150,000 sale.
At the other end, San Pedro produced the month's most accessible closings, with multiple condominium sales between $390,000 and $475,000.
What Should South Bay Buyers and Sellers Watch This Fall?
Three things. First, whether the price-reduction share keeps climbing. At 39.4% it is already elevated, and if it pushes past 45% region-wide it changes the negotiating posture materially. Second, whether Manhattan Beach volume recovers in September, because a halving of closed sales in one month is either seasonality or the start of something. Third, rates. At 6.71% we are in the same band we have been in all year, and I do not expect a move large enough to change buyer behavior before the end of the year.
In my 33-plus years covering this market, the months that look confusing in the aggregate are usually the ones where the top and the middle separate. That is exactly what August was.
Frequently Asked Questions
What is the median home price in the South Bay right now? The median sale price across nine South Bay and Palos Verdes cities was $1,460,000 for homes that closed in August 2026, based on CRMLS data covering 280 closed transactions. That is down 7.4% from the July 2026 median of $1,577,000. Individual cities vary widely, from a median of $750,000 in San Pedro to $4,525,000 in Palos Verdes Estates.
Are South Bay home prices going down in 2026? Yes. South Bay home prices went down in August 2026. The nine-city median fell 7.4% month over month, from $1,577,000 in July to $1,460,000 in August, and closed sales dropped 11.1% over the same period. Four of the nine cities posted a lower median than in July, including Torrance and Redondo Beach, the two highest-volume markets in the region. This follows the same direction as Los Angeles County overall, where the California Association of REALTORS® reported a 2.6% year-over-year median price decline in its July 2026 report.
Which South Bay city is the most expensive in August 2026? Palos Verdes Estates was the most expensive South Bay city with meaningful volume in August 2026, at a median closed sale price of $4,525,000 across 23 transactions. Rolling Hills posted a higher median at $4,637,500, but on only 4 closed sales, which is too small a sample to rank reliably. Manhattan Beach was third at $3,437,500 across 22 sales.
How long does it take to sell a house in the South Bay? The median South Bay home that closed in August 2026 spent 16.5 days on market, slightly faster than July's 18 days. Hermosa Beach was fastest at a median of 12.5 days, followed by Torrance at 13 days. Rolling Hills was slowest at a median of 50 days. These figures reflect homes that actually sold, and do not include the 39.4% of currently active listings that have taken a price reduction while waiting.
Is it a buyer's market or a seller's market in the South Bay? It is still technically a seller's market, but a thinner one than a year ago. The nine cities carried 616 active listings on September 5, 2026, about 2.2 months of inventory at August's sales pace, well below the five to six months that typically defines a balanced market. What has changed is pricing discipline: nearly 40% of standing inventory has already cut its price, so sellers no longer get the benefit of the doubt on an aggressive list price.
Where should a buyer look for the most negotiating room in the South Bay? Rancho Palos Verdes and San Pedro currently offer the most leverage. Rancho Palos Verdes carries 117 active listings and 4.5 months of inventory, the deepest supply in the report, with 40.2% of listings already reduced. San Pedro has 108 active listings, 3.3 months of inventory, and the highest price-reduction share at 48.1%, along with the lowest median price at $750,000.
Where Does Your Specific Pocket Stand?
Nine cities and fifty-three MLS areas roll up into the numbers above, and no single median describes what your street is doing. Valmonte does not trade like Malaga Cove. The Sand Section does not trade like the Hill Section. North Redondo does not trade like South Redondo. If you are weighing a move this fall, the number that matters is the one for your block, not the region.
I have been working this market for 33-plus years and I was born and raised on the Palos Verdes Peninsula. If you want to know what your home is actually worth in a September 2026 market, or where your budget goes furthest right now, call or text me directly at 310-592-1243, or start with a home valuation.
Before you Buy or Sell, Get the Intel.
About the data. Statistics in this report cover residential closed sales (single family residence, condominium and townhouse) with a close date between August 1 and August 31, 2026, compared against closed sales between July 1 and July 31, 2026, across 53 CRMLS areas covering Palos Verdes Estates, Rancho Palos Verdes, Rolling Hills, Rolling Hills Estates, Manhattan Beach, Hermosa Beach, Redondo Beach, Torrance and San Pedro. Active listing counts and price-reduction shares are measured as of September 5, 2026. "Price reduction" means a listing whose most recent MLS status change was a price decrease. Because this is an area-based MLS pull, these figures will not reconcile exactly with figures published by the California Association of REALTORS®, Trendgraphix, Redfin or other sources, which use different geographic boundaries and methodologies.
Sources. Closed sales, median and average prices, days on market, active inventory and price-reduction counts: California Regional Multiple Listing Service (CRMLS), data obtained September 5, 2026. Mortgage rate figures: Freddie Mac Primary Mortgage Market Survey, released September 3, 2026. Los Angeles County median price and sales change: California Association of REALTORS®, July 2026 Home Sales and Price Report, released August 17, 2026.
Based on information from California Regional Multiple Listing Service, Inc. as of September 5, 2026 and/or other sources. All data, including all measurements and calculations of area, is obtained from various sources and has not been, and will not be, verified by broker or MLS. All information should be independently reviewed and verified for accuracy. Properties may or may not be listed by the office/agent presenting the information.